
Our Ranking System
Companies Ranked as Candidates For Investment
In the first four entries in this series, we looked at Quality Ranked companies , Earnings Growth Ranked companies, Financial Strength Ranked companies, and Fundamental Ranked companies. Today, we are going to look at companies to see if they are Candidates For Investment based upon aggregating the four ranking systems.
Over the years, I have found that when a company ranks highly on all four of the ranking systems, they are a strong candidate for further due diligence to see if they make the cut to be included in client portfolios.
Below are a selection of companies from our database with a rank above 90 on each of the four ranking systems and a history of above average bear market performance plus those with a rank below 60 on each of the ranking systems and a history of very weak bear market performance.
| Company Name | Quality Rank | Earnings Growth Rank | Financial Strength Rank | Fundamental Rank | 10-yr Avg Return |
|---|---|---|---|---|---|
|
Avery Dennison Corp |
98.4 |
96.3 |
93.8 |
92.3 |
19.55% |
|
Cabot Oil & Gas Corp |
97.8 |
95.2 |
99.4 |
95.1 |
0.93% |
|
Jazz Pharmaceuticals PLC |
98.6 |
95.1 |
91.1 |
95.6 |
18.91% |
|
Mercury General Corp |
92.9 |
94.6 |
98.7 |
98.1 |
8.37% |
|
NVR Inc |
99.9 |
98.2 |
97.7 |
93.6 |
21.08% |
|
Rio Tinto PLC |
96.5 |
95 |
94.1 |
99.9 |
4.98% |
|
Southern Copper Corp |
91.5 |
98.3 |
93.6 |
95.6 |
9.39% |
|
The Toro Co |
92.4 |
93 |
92.6 |
94.7 |
22.59% |
|
Werner Enterprises Inc |
90.2 |
96.1 |
94.3 |
97 |
7.84% |
|
Winnebago Industries Inc |
98.3 |
99.6 |
98 |
94.2 |
22.40% |
|
Altisource Portfolio Solutions SA |
31 |
4.7 |
13.1 |
27.2 |
-6.74% |
|
FuelCell Energy Inc |
24.7 |
25.6 |
21.1 |
27.2 |
-26.28% |
|
Fluor Corp |
49.2 |
30.4 |
49.1 |
59.9 |
-9.00% |
|
The Howard Hughes Corp |
40.8 |
37.8 |
20.9 |
43.8 |
4.53% |
|
Ocean Power Technologies Inc |
59 |
29.4 |
11.8 |
10.8 |
-42.96% |
|
Spirit AeroSystems Holdings Inc |
40.2 |
13.1 |
14.8 |
38.5 |
9.08% |
|
Triumph Group Inc |
34.8 |
43.1 |
45.2 |
44.3 |
-7.61% |
|
Tata Motors Ltd |
22 |
41.7 |
34.4 |
46 |
0.93% |
|
AgEagle Aerial Systems Inc |
9.4 |
30.1 |
11.5 |
15.3 |
-32.32% |
|
Wynn Resorts Ltd |
32.9 |
16.3 |
13 |
33.2 |
1.64% |
A review of the chart above will indicate that the companies highly ranked ranked performed better on average over the past ten years than those ranked low. So, lets look at the scatter graph for a visual analysis:
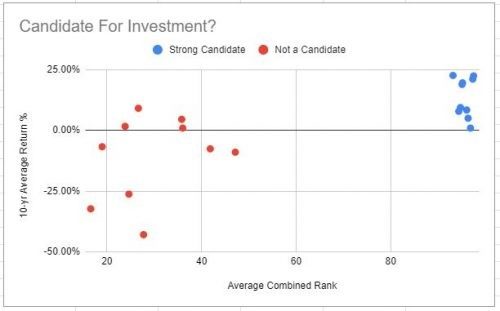
Looking at the graph, it is easy to conclude that the companies ranked highly on all four ranking systems have materially out-performed those with low ranks on all four ranking systems on average over the past ten years.
Why Is This Important Now?
In the first entry in this series, I mentioned that the Federal Reserve had begun to discuss tightening monetary policy, an event that has in the past led to stock market corrections and sometimes full bear markets. Given their recent statements, it is prudent to know how companies will perform when there is not a significant stimulus pushing their stock prices higher.
Investment Strategy
In the normal course of portfolio management during this period in time where we have been warned that monetary tightening is in the plans, we want to book the gains on the companies that show the least ability to withstand a bear market and focus on the companies that have the best ability to withstand a bear market. We do not want to see the gains we have made be lost by not monetizing them when the market tells us it is time.
Summary
In the six posts in this blog series, we looked at four of our Ranking Systems and compared them to the 3-year Average Return for companies ranked both high and low by the systems. We then looked at how the combining the systems compared to both 3-year and 10-year Average returns. The analysis showed that by relying on the results of the analytical ranking systems provides a start for further due diligence on those that appear to be strong candidates for investment to see if they should in fact be included in client portfolios.
-Mark