
Important Indicators Of Company Performance
I like metrics. They give me a quick way to both monitor the performance of a company I own and to indicate whether further due diligence is warranted on a company I currently do not own.
I use several metrics that give me a feel for how a company is performing as that performance translates into stock price performance (or at least it should subject to valuation levels and sentiment).
One of my top metrics is one I call the High Performer 15’s. This is a set of ratios that all must exceed 15%:
- Earnings Per Share Growth > 15%
- Revenue Per Share Growth > 15%
- Return on Equity > 15%
- Operating Margin > 15%
- Book Value Growth > 15%
- Return on Invested Capital > 15%
This set of six ratios tells me whether a company is growing, whether it is operating efficiently and effectively, whether they are building value and providing top level returns for its shareholders. This is a tough hurdle for most companies to pass; in my database of 1200 companies that I follow, only 45 meet or exceed all six of these ratios. Here is that list:
| Ticker | Company | Stock Sector | Style | 3yr Avg Return | 10yr Avg Return | Valuation |
|---|---|---|---|---|---|---|
|
ADBE |
Adobe Inc |
Technology |
Large Growth |
35% |
39% |
Fairly Valued |
|
ALGN |
Align Technology Inc |
Healthcare |
Large Growth |
23% |
45% |
Materially Overvalued |
|
AMAT |
Applied Materials Inc |
Technology |
Large Growth |
43% |
29% |
Fairly Valued |
|
AMD |
Advanced Micro Devices Inc |
Technology |
Large Growth |
78% |
33% |
Fairly Valued |
|
APPS |
Digital Turbine Inc |
Technology |
Small Growth |
255% |
35% |
Materially Overvalued |
|
APT |
Alpha Pro Tech Ltd |
Industrials |
Small Core |
39% |
21% |
Fairly Valued |
|
ATVI |
Activision Blizzard Inc |
Communication Services |
Large Core |
5% |
22% |
Fairly Valued |
|
COWN |
Cowen Inc Class A |
Financial Services |
Small Value |
39% |
11% |
Fairly Valued |
|
CTLT |
Catalent Inc |
Healthcare |
Mid-Cap Growth |
45% |
– |
Materially Overvalued |
|
DGX |
Quest Diagnostics Inc |
Healthcare |
Mid-Cap Value |
13% |
13% |
Overvalued |
|
DHR |
Danaher Corp |
Healthcare |
Large Growth |
45% |
26% |
Materially Overvalued |
|
DISH |
DISH Network Corp Class A |
Communication Services |
Mid-Cap Value |
5% |
7% |
Fairly Valued |
|
DXCM |
DexCom Inc |
Healthcare |
Large Growth |
61% |
47% |
Materially Overvalued |
|
EBAY |
eBay Inc |
Consumer Cyclical |
Large Core |
25% |
20% |
Overvalued |
|
EBS |
Emergent BioSolutions Inc |
Healthcare |
Small Core |
3% |
15% |
Fairly Valued |
|
ETSY |
Etsy Inc |
Consumer Cyclical |
Mid-Cap Growth |
61% |
– |
Overvalued |
|
EXP |
Eagle Materials Inc |
Basic Materials |
Small Core |
14% |
24% |
Overvalued |
|
FB |
Facebook Inc Class A |
Communication Services |
Large Growth |
25% |
– |
Fairly Valued |
|
GMAB |
Genmab A/S ADR |
Healthcare |
Large Growth |
41% |
54% |
Materially Overvalued |
|
HRB |
H&R Block Inc |
Consumer Cyclical |
Small Value |
3% |
10% |
Fairly Valued |
|
KLAC |
KLA Corp |
Technology |
Large Core |
46% |
27% |
Fairly Valued |
|
LH |
Laboratory Corp of America Holdings |
Healthcare |
Mid-Cap Value |
19% |
14% |
Overvalued |
|
LOGI |
Logitech International SA |
Technology |
Large Growth |
34% |
26% |
Fairly Valued |
|
MASI |
Masimo Corp |
Healthcare |
Mid-Cap Core |
36% |
28% |
Overvalued |
|
MKSI |
MKS Instruments Inc |
Technology |
Mid-Cap Core |
19% |
21% |
Fairly Valued |
|
MKTX |
MarketAxess Holdings Inc |
Financial Services |
Mid-Cap Growth |
38% |
33% |
Materially Overvalued |
|
MSFT |
Microsoft Corp |
Technology |
Large Core |
39% |
28% |
Undervalued |
|
NBIX |
Neurocrine Biosciences Inc |
Healthcare |
Mid-Cap Growth |
-9% |
32% |
Fairly Valued |
|
NFLX |
Netflix Inc |
Communication Services |
Large Growth |
14% |
34% |
Materially Overvalued |
|
NKE |
Nike Inc Class B |
Consumer Cyclical |
Large Growth |
29% |
23% |
Overvalued |
|
NVDA |
NVIDIA Corp |
Technology |
Large Growth |
47% |
53% |
Overvalued |
|
NXST |
Nexstar Media Group Inc Class A |
Communication Services |
Small Value |
27% |
39% |
Fairly Valued |
|
PKI |
PerkinElmer Inc |
Healthcare |
Mid-Cap Core |
30% |
24% |
Materially Overvalued |
|
PYPL |
PayPal Holdings Inc |
Financial Services |
Large Growth |
47% |
– |
Materially Overvalued |
|
QDEL |
Quidel Corp |
Healthcare |
Small Core |
24% |
26% |
Fairly Valued |
|
RILY |
B. Riley Financial Inc |
Financial Services |
Small Core |
51% |
41% |
Fairly Valued |
|
TER |
Teradyne Inc |
Technology |
Mid-Cap Growth |
44% |
27% |
Fairly Valued |
|
TGNA |
Tegna Inc |
Communication Services |
Small Value |
19% |
16% |
Fairly Valued |
|
TMO |
Thermo Fisher Scientific Inc |
Healthcare |
Large Growth |
33% |
27% |
Overvalued |
|
TTD |
The Trade Desk Inc A |
Technology |
Mid-Cap Growth |
106% |
– |
Materially Overvalued |
|
VEEV |
Veeva Systems Inc Class A |
Healthcare |
Large Growth |
59% |
– |
Fairly Valued |
|
VRTX |
Vertex Pharmaceuticals Inc |
Healthcare |
Large Core |
5% |
16% |
Undervalued |
|
WSM |
Williams-Sonoma Inc |
Consumer Cyclical |
Mid-Cap Core |
39% |
20% |
Fairly Valued |
|
YETI |
YETI Holdings Inc |
Consumer Cyclical |
Mid-Cap Growth |
– |
– |
Materially Overvalued |
|
ZM |
Zoom Video Communications Inc |
Technology |
Large Growth |
– |
– |
Overvalued |
This list does not provide a template for a fully diversified portfolio – it is heavily weighted toward technology and communications companies, with limited to no exposure to large sectors of the market like Industrials, Financials, Real Estate, Energy or Utilities
Many of these companies do show up in client portfolios – others do not as they may be too overvalued to purchase at this time, we may have full allocations to their sector without them, they may not meet our financial strength requirements, the projected outlook for them is not as solid as their past performance, they may have just recently joined this list and are candidates for purchase, or one of many other reasons.
There are other metrics that I follow that will give me other lists of companies, some of which we own and some of which we do not. The point is that there is not one way to know whether you want to buy or sell a company – but it all comes down to fundamental analysis of their financial statements, their industries, their competition, and their prospects. However, if you look at the 3yr and 10yr average returns of the companies on this list, they predominantly have been companies that you want to own and that have provided you with well above average returns.
So why wouldn’t we just own all of them and call it a day? It goes back to the fundamental analysis. If we look at a company like Quidel Corp you can see that it is fairly valued (an important factor if you want to be a buyer – remember in a previous blog post we discussed forward returns and how they are impacted by the price at which you buy a stock) and has had mid-20% average returns over three and ten years. But when you look at their forward prospects you have to stop and wonder if they will continue – I write that because Quidel Corp is one of the primary providers of the Covid-19 tests that have been so prominent in our lives for most of the past two years. Check out their stock price chart below:
Why Is This Important Now?
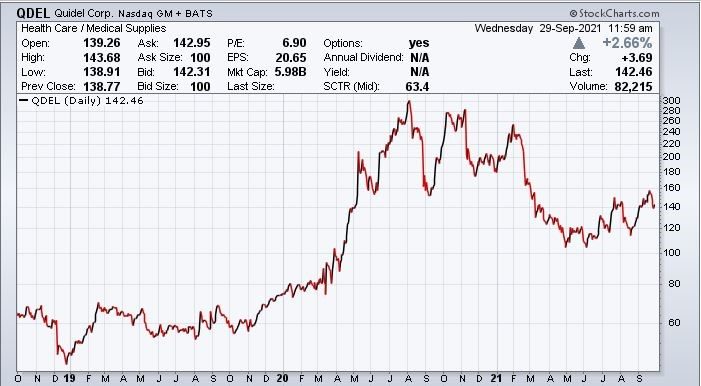
This is a three-year price chart and you can see how their stock price skyrocketed higher in the Spring of last year coincident with the start of Covid-19, how it fell back in the Spring of this year but has moved back up roughly 30% higher since the Delta variant has been prevalent. When we get past the Delta variant, will QDEL still be on this list? Will its stock price continue to return mid-20% on average over the next three or ten years?
My best guess is that Covid-19 will be with us for longer than any of us would like – there will likely be new variants that will hit us generating the need for more tests, and that their performance will keep QDEL on this list. Given that, I want to own this company and have slowly been adding shares to client accounts where they were below target equity allocations – but I added partial positions so that if we get a pull back in price I can build a full position at an improved basis.
You can develop your own set of metrics to manage your investment portfolio – it just takes time and research to find a set that will give you a list of stocks upon which you can do your own due diligence before investing. The metric is not the final answer as to whether you should own a specific company, as we saw with QDEL above. However, they can provide you with a good place to start.
If you don’t want to do the work and want to be a client so that I do the work for you, you can call or email me at the contact information on this website and we can discuss next steps.
I will be back with other metrics and the lists of companies they generate in coming posts, so watch for those in the near future.
– Mark