
Our Ranking
Our proprietary investment analysis system is able to rank the 1200 companies I keep in our database according to several factors. These factors lead us to six ranks based upon traditional investment concepts: Earnings Growth, Financial Strength, Value, Momentum, Quality and Fundamentals. Each of the rankings combines several financial ratios that reflect each of the above investment concepts, and they are chosen based upon years of analysis that show that these specific ratios provide me with a clear picture of how the company fairs under each concept. They are ranked from 100 (best) to 1 (worst) on a relative basis to their industry and to the S&P 1500.
Earnings Growth Ranked Companies
Our Earnings Growth Rank is the original analytical system whose nexus started with my Masters Thesis. The thesis set out to disprove the Efficient Market Hypothesis (yes, that is how long ago it was – it has graduated to a Theory and is no longer a Hypothesis). The synopsis of the thesis was that in spite of the strong support for the Hypothesis, there really are certain financial ratios in the public realm that when viewed as a whole can provide index beating returns over the long run. And given our track record of beating the index over the long run, the Earnings Growth Rank is a very important part of our investment process.
There are several financial ratios that comprise the Earnings Growth Rank, but they can categorized into four main groupings: Earnings Per Share Growth; Sales Growth; Operating Income Growth; and Cash Flow. There are nineteen ratios that are distributed between these four primary groupings, but when taken as a complete package, provide a good look into which companies are investable based upon their income statement.
Below is a non-exhaustive list of companies from our database that are designated either High Growth or Low Growth based upon, among other factors, their Earnings Growth Rank.
| Designation | Company Name | Earnings Growth Rank | 3-yr Avg Return |
|---|---|---|---|
|
High Growth |
Broadcom Inc |
98 |
25% |
|
High Growth |
Berkshire Hathaway Inc |
95.1 |
15% |
|
High Growth |
Etsy Inc |
94.1 |
73% |
|
High Growth |
Genmab A/S |
94.9 |
37% |
|
High Growth |
Mercury General Corp |
94.6 |
14% |
|
High Growth |
National Fuel Gas Co |
94 |
3% |
|
High Growth |
Oracle Corp |
92.8 |
20% |
|
High Growth |
PayPal Holdings Inc |
95.7 |
46% |
|
High Growth |
Qorvo Inc |
98.9 |
31% |
|
High Growth |
Ross Stores Inc |
97.8 |
16% |
|
High Growth |
Southern Copper Corp |
98.3 |
16% |
|
High Growth |
Skyworks Solutions Inc |
98.6 |
20% |
|
High Growth |
Texas Instruments Inc |
95.4 |
20% |
|
Low Growth |
Alaska Air Group Inc |
42.9 |
6% |
|
Low Growth |
Apogee Enterprises Inc |
49.7 |
-2% |
|
Low Growth |
Bank of America Corp |
57.5 |
15% |
|
Low Growth |
Compass Minerals International Inc |
59.8 |
6% |
|
Low Growth |
Chevron Corp |
54.5 |
-1% |
|
Low Growth |
General Electric Co |
34.7 |
1% |
|
Low Growth |
Limoneira Co |
32.2 |
-7% |
|
Low Growth |
Palo Alto Networks Inc |
54.7 |
20% |
|
Low Growth |
Phillips 66 |
33.1 |
-6% |
|
Low Growth |
Raytheon Technologies Corp |
47.3 |
2% |
|
Low Growth |
Splunk Inc |
11.9 |
2% |
|
Low Growth |
Valero Energy Corp |
43.7 |
-9% |
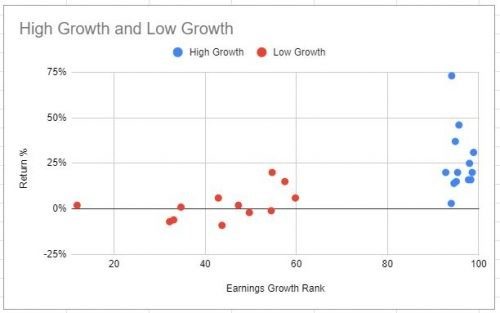
A quick look at the table gives you a good feel for the fact that the High Growth companies have performed much better over the last three years than the Low Growth companies. This may not always be the case as their are certain times when companies with low earnings growth scores will out-perform those with high earnings growth scores.
Below is a scatter plot that shows you visually the results of the above analysis – it is pretty apparent that the high growth companies performed better over the past three years than the low growth companies., even when taking into consideration the impact of the significant covid correction:
Why Is This Important Now?
Investment Strategy
In the normal course of portfolio management during this period in time where we have been warned that monetary tightening is in the plans, we want to book the gains on the companies that show the least ability to withstand a bear market and focus on the companies that have the best ability to withstand a bear market. We do not want to see the gains we have made be lost by not monetizing them when the market tells us it is time.
What’s Next?
In Part Three of this series, we will look at our Financial Strength Rank to see what it tells us that will be useful in managing portfolios to prepare for a correction or bear market at some point in the future.
-Mark