
Background
Recently, both CF Industries and Yara International, the two largest producers of Nitrogen fertilizer for agricultural use, announced that there will not be enough nitrogen available to meet farmers needs at least through 2023.
CF’s press release stated: “A shortage of nitrogen fertilizer due to soaring natural gas prices is threatening to reduce global crop yields next year, CF Industries, a major producer of the crop nutrient.”
Given this, I thought it would be interesting to look at a graph of the prices of Agriculture products to see if we can see any sort of trend and come up with an idea of how high prices might rise. To do that, I’ve used the commodity ETF DB Agriculture Fund below that tracks the Deutche Bank Ag Commodity Index to give you a feel for what is happening to Ag commodity prices. The Invesco DB Agricultural Fund (Ticker: DBA) consists of grains (37%), softs (sugar, coffee and cocoa 35%) and livestock (24%) and cotton (4%).
Analysis
Remember, when looking at graphs, they are visual representations of investor sentiment. They illustrate patterns of behavior that are based upon the fundamentals of the asset in question, including its valuation. Technical analysis works because investors are people, and people repeat successes and mistakes, and these show up as patterns on a graph.
Here is a weekly graph of DBA that shows you its price action over the past five years, the first three and a half of which were in a major bear market, from 2016 to until Spring 2020.
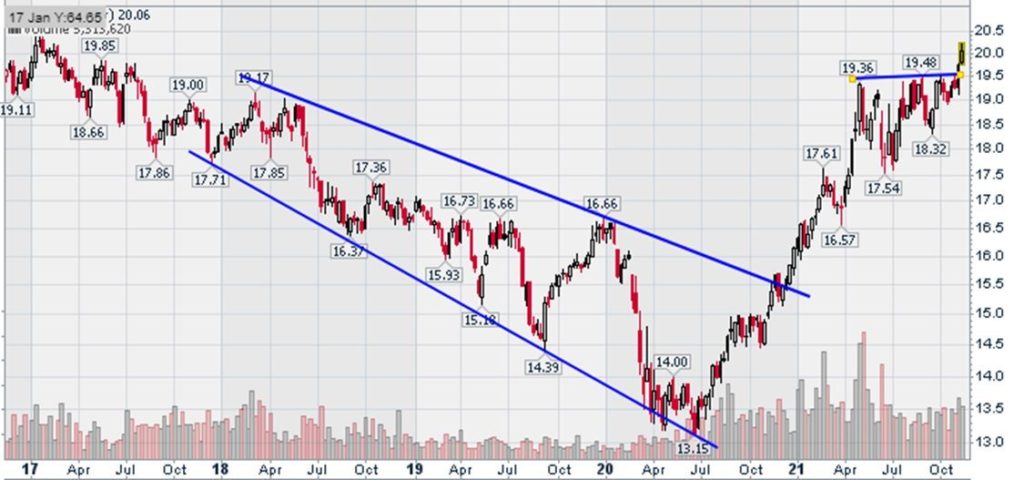
Late 2020 also saw it break above the green down trendline; that line represented the upper part of a broadening wedge. These formations, when completed, are particularly bullish, as they are often followed by a powerful advance.
The anatomy of a trend that shows up as a down-sloping broadening wedge generally follows this pattern (formed from the often repeated behaviors bullet pointed below):
- It begins when holders of an asset that has been on a bullish run decide that the value of the asset has peaked and they decide to take profits.
- That profit taking pushes the asset price below a key moving average.
- The drop below the moving average gets the attention of short sellers who relentlessly sell the asset to further drive the price down.
- At some level, buyers step in to buy the dip, and prices move up.
- The short sellers start selling again to drive the price down lower than before.
- This process continues with a series of lower highs and lower lows until the short sellers decide to take profits and the price moves up, finally breaking above the down-sloping upper upper boundary of the wedge.
That point where the short sellers took profits was in May 2020, and the break above the upper boundary took place in December 2020. That set 2021 up to be a major bull market in Ag commodities.
Like all bull markets, they take a breather and consolidate. In the case of DBA, May 2021 began the consolidation which took the form of an upward-sloping inverse head-and-shoulders, which finally gave way to an upside breakout coincident with the news that there would be a shortage of Nitrogen fertilizer leading to a shortage of Ag commodities.
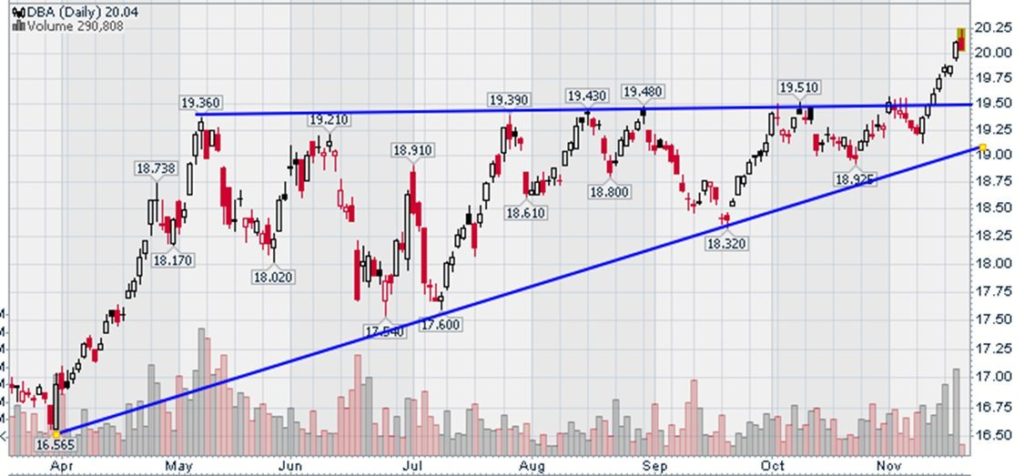
Chart 2 below gives you a close-up view of this consolidation period that took place in the form of an ascending triangle pattern that tends to be bullish.
You can see how the stock price moved up and down in narrowing configuration, and the recent break above the year-long resistance line with the Nitrogen news as a catalyst.
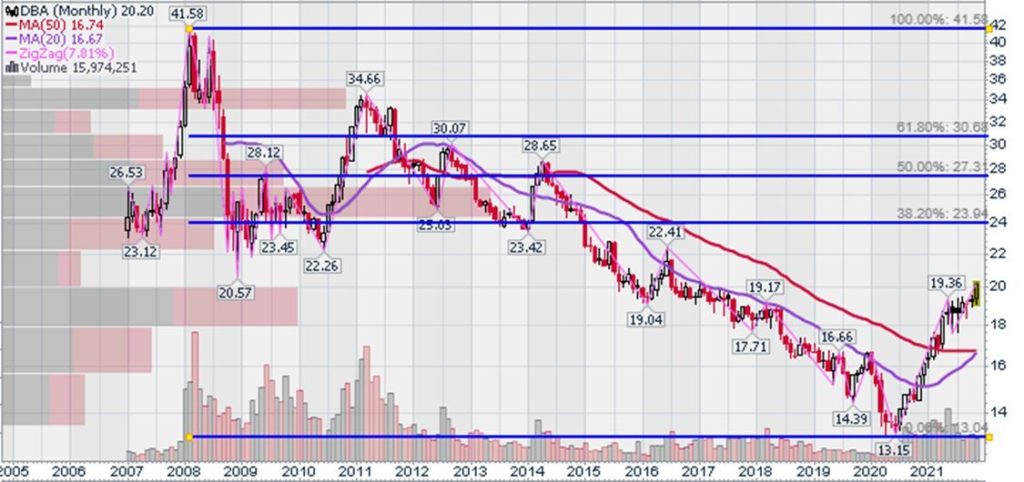
So now that we have had the technical price breakout based upon a strong fundamental catalyst, where might we see prices go? To answer that, below I have added a Fibonacci Retracement overlay to our monthly price graph. but I have extended the time from back to 2006 so you can see the all time high price peak in 2008.
The Fibonacci Retracement overlay provides a visual demonstration of a set of ratios, defined by the mathematically important Fibonacci sequence, that allow traders to identify key levels of support and resistance for stocks. In our case, we drew the overlay from the 2008 peak to the 2020 bottom of the chart. You can see how the stock price has reacted with the support and resistance levels over the twelve year period from peak to trough.
Estimates of Price Increase
To draw a conclusion based upon this, we see that this move higher off the bottom still has a 20% price increase to reach the initial 38.20% retracement level and a 40% price increase to reach the 50% retracement level.
Technical analysis is not an exact science since it simply looks at patterns of past investor behavior to suggest future price movements. In the case of Agriculture commodity prices, there is a distinct catalyst in the form of a Nitrogen shortage that will drive prices higher.
This can easily get us to a 20% increase in Ag prices from today’s levels if not 25%. If we see the Potash companies, which also use significant levels of natural gas in their processing, make similar statements as CF and Yara, the 61.80% retracement level should come into play giving us a 55% increase in Ag commodity prices from today’s levels.
Investment Implications
Last year, we began to increase exposure to the Ag Industry in client portfolios so that there was a defined focus on Ag stocks. This was obviously well ahead of the Nitrogen news detailed above, but rather it was based upon two things: (1) the likelihood that we would see inflation generated by the massive monetary and fiscal stimulus coming out of DC; and (2) the sun’s solar flare cycle that was entering a cooling period.
I’ve written on the blog about the likelihood of inflation, so I won’t repeat that, but I don’t recall talking about the solar cycle and its cooling period. The cooling period historically has impacted crop yields for the worse, raising the price of ag commodities which in turn tends to increase the value of the companies in the Ag Industry that work to increase yields during a time of production stress. The Nitrogen news simply means that the tailwinds behind the companies in this industry are stronger and more likely to increase valuations.
The companies in our clients portfolios represent the Ag Industry include Machinery (Deere and Agco), Retail Sales (Titan Machinery), and Inputs (CF Industries, Mosaic, and Nutrien).
The Ag focus has served our clients well since September 2020 when we increased exposure. Here is an example graph of CF Industries, which I thought would be interesting given that their press release generated the idea for this post:
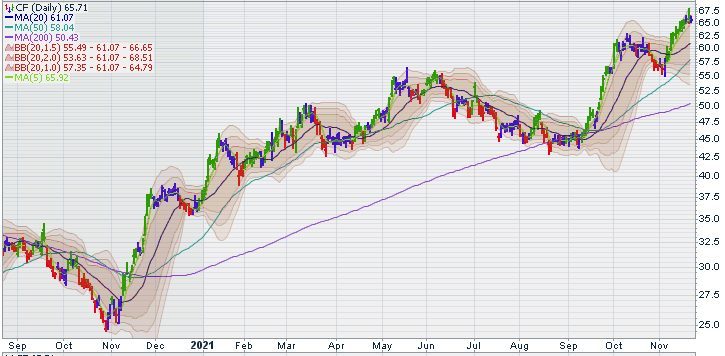
Most clients have two tax lots of CF, the original purchase on September 18 at $33.97 and a second purchase on October 22 at $27.62, after we had the pull back that you can see on the graph above. With the company now trading at $65.71, clients have a double in this particular Ag stock. If you were to look at the charts of the other Ag stocks noted above, you would see similar results.
If we get a pullback in the broad market, it is very likely that I will add a new company to our Ag stocks holdings and let these continue to ride through the Nitrogen shortage that is projected to go into 2023.
Conclusion
As always, this is not investment advice, but rather a description of what I am doing with my clients’ investment portfolios and why. You should do your own due diligence if you decide to utilize any information in this blog to make investment decisions.
If you would like us to help you manage your investments according to our investment strategy and the tactical aspects, like an Ag stock focus, discussed here please contact me at [email protected] to discuss is.
And finally, a hat tip goes to the stockcharts.com blog for their timely post on Ag price inflation and their analysis of DBA while I had the Nitrogen press releases on my mind.