
THE MARKETS
We all lived through 2022 and it was an ugly year in the markets. Both stock and bond indexes were down in double digits and most of the investment world suffered severe losses for their clients. Here at BankChampaign, our clients faired much better than the markets overall, but we will discuss more about that below.
For the first time in a very long time, bonds lost as much or more value than stocks depending upon the maturity. As interest rates rose, stocks fell because the discount rate used to value future earnings and cash flows increased, making them less valuable. As interest rates rose, bonds acted predictably and fell so that existing bonds were priced to yield the same as newly issued bonds.
One of the tried and true investment allocations is the 60/40 stocks-to-bonds allocation. Historically, this asset mix allowed investors to weather the storm of market corrections since bonds typically increase in value as stocks decrease in value given that investors switch from stocks to bonds and that demand for less volatile investments drives up the bond prices. This is the relationship that most investment managers know because they have not lived through a period of sustained rate increases by the Federal Reserve and a shift in the entire yield curve impacting all bond maturities. This meant that when the investment managers shifted money out of stock portfolios believing that they were doing something in their clients best interest, they actually were not helping at all.
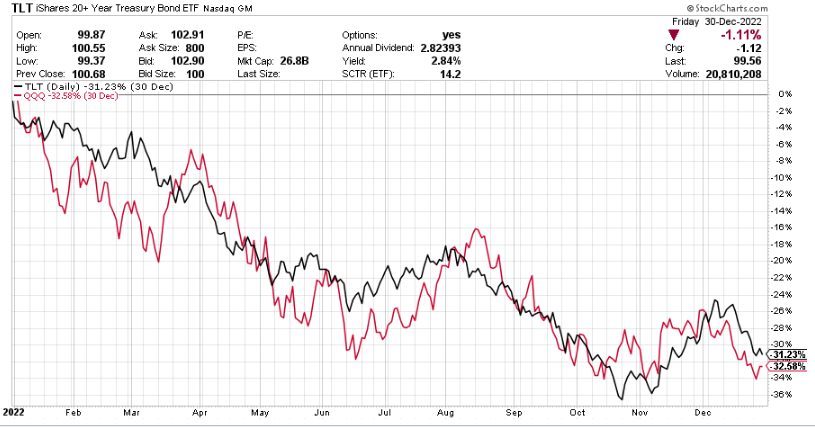
Below is a graph that illustrates the price performance of two Exchange Traded Funds (ETFs), QQQ and TLT. QQQ is the ETF that mirrors the NASDAQ 100 Index (in red below) and TLT is the ETF that mirror the 20 Year+ Treasury Bond Index (in black below). Normally, you believe that bonds are safer than stocks, particularly the stocks in the index that was most overvalued coming into 2022. However, as the graph below show, the QQQ and the TLT lost roughly the same amount during 2022, down over -30%. Can you imagine what this does to client portfolios when you think that you were following standard investment management practice and shifting from stocks to bonds? They still lose money.
Yes, I picked the two extremes for the example above, so below I’ve tried be more realistic and below you can see the relationship between the 3-7 year Treasury Bond ETF (in black), the 5-10 year Corporate Bond ETF (in green), and the ETF that replicates the Dow Jones Industrial Average (in red). I chose these three because (1) most bond mutual funds that investment managers buy for their clients are in that in the 6 year duration range and will be a mix of Treasury Bonds and Corporate Bonds; and (2) at the end of 2021, most Wall Street investment houses were advocating moving from Growth style stocks (like in the NASDAQ 100) to Value style stocks (like in the DJIA).
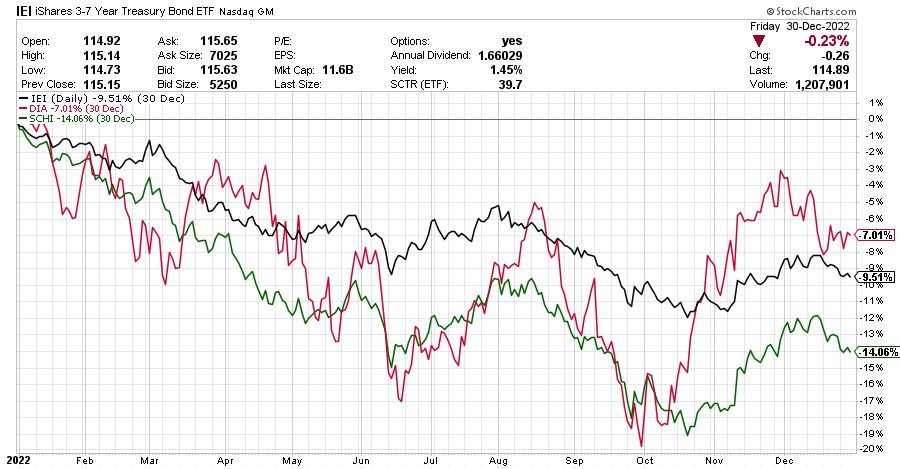
Obviously, the call to move to Value stocks was the right one as the DJIA handily beat the NASDAQ 100 in performance in 2022. But the swap to bonds from value stocks was not the right move. If the investment manager didn’t move to an all value stock portfolio for their clients (and most didn’t) but instead the client was in a broadly diversified portfolio of stocks that included both growth and value, similar to the S&P 500 Index, they would have faired worse as the S&P 500 Index was down over 18%.
The above analysis assumes that most investment managers kept their clients in a portfolio of mutual funds, which is by far the predominant investment methodology utilized my investment managers. The analysis also assumes that they used mutual funds that were benchmarked to the indices depicted above. If they kept their clients in individual stocks and bonds, or the mutual funds they used were benchmarked to other indices, their returns could be much different.
BANKCHAMPAIGN PERFORMANCE
Above I told you that our clients significantly outperformed the indexes. That can be attributed primarily to: (1) a focus on individual stocks when client portfolios allow because we have more control of exact companies in which our clients are invested; (2) a focus on specific industries that have catalysts behind them that don’t rely on low interest rates for stock price performance; and (3) to the greatest extent possible, avoid bond mutual funds and utilize laddered portfolios of fixed income securities (bonds, certificates of deposit, etc. – and the logic is explained in tomorrow’s blog post.)
Compliance does not allow me to tell you exact client returns.
However, I can tell you what our model portfolios did during 2022. These model portfolios are the basis for our investment management – each client’s portfolio is tied to a model but none will own the exact stocks in the exact weights or have the exact timing as the model. This is due to several client specific reasons, like cash flow into and out of portfolios, portfolio size not sufficient to own all stocks in the model, timing of purchases and sales due to things like capital gain management. It is also due to normal investment management reasons, like over-weighting/under-weighting companies or industries, raising cash in advance of market corrections, booking profits or cutting losses when it makes sense, and various other things that can happen in the normal management of a client’s portfolio. As such, actual client returns can be above or below that of the model.
What the model does demonstrate is the performance of the stocks that we research and select to be in a portfolio when held in a static manner over a period of time with no changes made other than an annual reweighting to bring all into line with strategic percentage allocations. This is obviously a much different scenario than real life and should be viewed in a more academic light rather than thought of as the reality of investing for clients that have different goals, resources, wants, and needs.
In no way does this represent actual client account performance since even though client portfolios are based upon the companies in the model they do not and cannot replicate it due to the factors noted above.
The Model Portfolios
We have two primary model portfolios that follow client selected investment strategies: (1) a Growth Strategy Model, and (2) a Blue Chip Dividend Strategy Model. We also have a Core Strategy Model that is a blending these two. Although these strategies are tailored for our individual stock portfolio clients, we also offer mutual fund portfolios, index fund portfolios, and ETF portfolios that follow the Core Strategy and allows us to over-weigh and under-weight growth and value stock styles in these portfolios to manage risk and enhance performance.
For 2022, the Growth Strategy Model for individual stocks was down -2.80% compared to its S&P 500 Index benchmark at -18.23%. The Blue Chip Dividend Strategy Model for individual stocks was UP +3.08% compared the the down -18.23% for the S&P 500 Index. Remember, these performance numbers are for the models and actual client returns can be higher or lower.
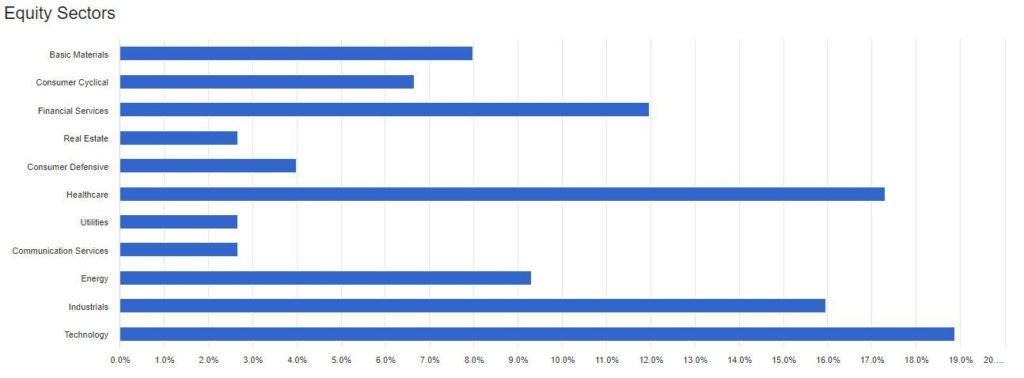
These are both model portfolios that contain 75 stocks. Each stock is equally weighted and the portfolio is allocated across all economic sectors. Below are the sector analyses for the Growth and Blue Chip Dividend Strategy Models for individual stocks.
Growth Strategy Model Equity Sector Analysis
Blue Chip Dividend Strategy Model Equity Sector Analysis
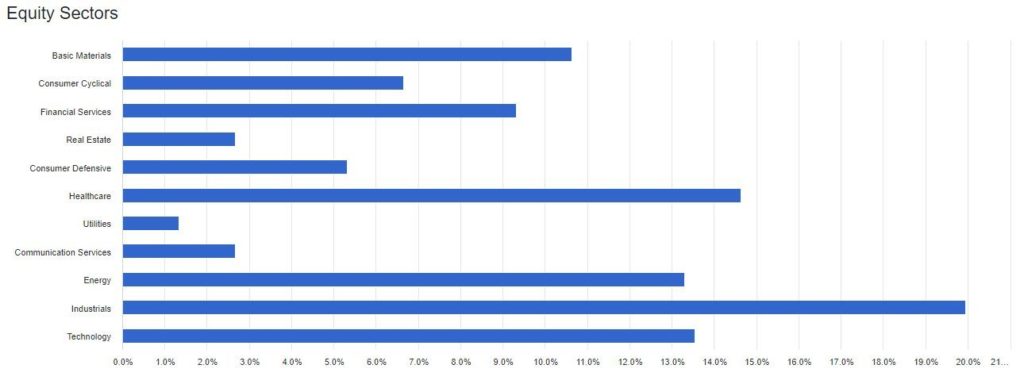
In looking at the two, you can see some definite difference between the two models in terms of how they approach exposure to the economic sectors.
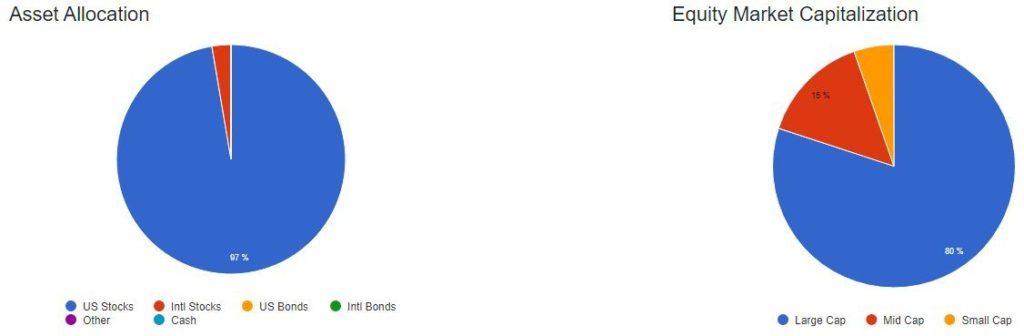
Below are pie charts that the asset allocation and company equity market capitalization of the two models.
Growth Stock Strategy Model Asset Allocation and Equity Market Capitalization Analysis
Blue Chip Dividend Strategy Model Asset Allocation and Equity Market Capitalization Analysis
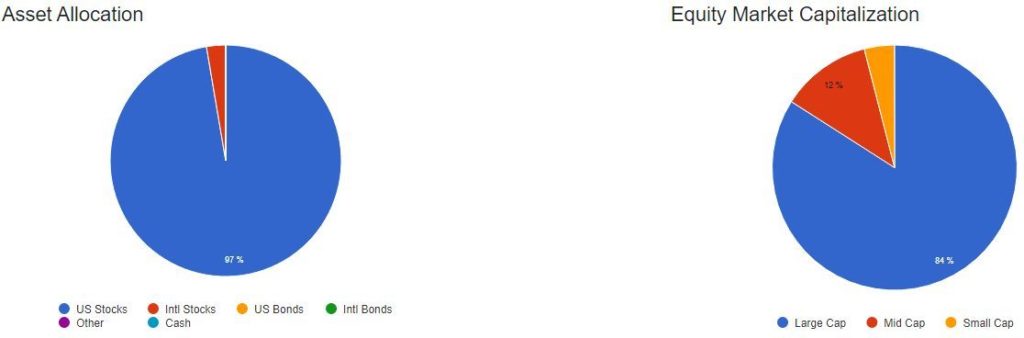
Again, you can see that there are difference between the two strategies.
CLOSING
No one wants to read a blog the size of War and Peace, so I’ll cut this off here and resume tomorrow with further detail on the models. We will also be discussing how the stocks that comprise the models were selected and we will provide further details on the non-individual securities portfolios we manage and how their strategy models performed.
–Mark